
Brutal Editorial Honesty:
This post is intended to convince you to try the XLPublish Add-In for Excel in your work and in your organization. Please read on …
Pre-Apology:
Here we go … a loong posting that is effectively a White Paper, I guess. Sorry 😦 the topic of this post is just too large for small bullet-point minimizations. I believe that this trend for “keeping it simple”, while practical in everyday business, sometimes is just inadequate. This is one of this topics and one of those times.
My BI “Cred” :
I am a database developer of long standing (late 80’s) as well as a spread-sheeter for a living since 1985. Believe me, I personally understand how transactional date really must NOT/can NOT be kept in spreadsheets and have spent decades promoting this idea.
I did my first Excel/OLAP solution for Citibank in New York City in 1994-6. It was internally known as “Citilens” and it queried a Sybase OLAP Server from Excel using an OCX and returned Daaset data to Excel where I created a OPivot-Table like output using VHA macros. Then users could literally “drill-down” by clicking on a cell tuple and the VBA would run a drill-down to the Server and the returned data would then be added to a new Worksheets showing thte drilled data and so on and so on. I gotta admit it was really cool !! 🙂 .
It worked really great for a couple of years! While it was a big success (until the group I worked for disappeared in a merger along with the solution 😦 ), I had already come to the conclusion that true BI (traditional Dr.Codd stuff) was just way too out there for any such thing beyond a centralized IT implementation even with an Excel front-end.
But let’s not forget that companies EVERYWHERE are collecting huge amounts of data into Servers just through the normal activities of running their businesses anyway – it’s available for free 🙂 – to Excel users like you!
Self-Service BI:
Move forward to the early ’10’s and the “party-line” definition of “Self-Service BI” has been “coined”. All the talk about Self-Service BI for the last few years caught my eye with the release of Denali in 2011 and Power BI for Office 365 in 2013. (Note …While this post is about Power BI I believe that it all probably applies to competitive products currently on the market).
I define “Self-Service BI” as:
“Corporate Power Users and Analysts making “bespoke” Visualizations of Company Data and Results in Power BI while sourcing their data from Data Mart tables assembled and managed by IT (centrally) or from Internet sources. The User then Publishes the results in a “pretty” Browser interface on any device anywhere”.
But my biggest concerns were very simple… namely:
- If the vast majority of business knowledge and analysis is in Microsoft Excel files now what kind of disruption would a complete abandonment of spreadsheets to be replaced by Data Marts, Warehouses, Oceans, Pools (or whatever collective storage paradigm you want to use) mean for every company on the planet?
- Who would do the planning, the design and the work?
- What mechanisms would have to be put in place to support, maintain and evolve this centralized data store?
- What completely new skills will your users need to learn and how will you develop a pool of ongoing skills in your organization to sustain all this new tech, data and visuals.
- and so on and so on and so on …
If all of this could be accomplished, it would be all well and good. BUT, as a noted contrarian, or someone who draws their own conclusions from the facts available (same thing today, apparently), I concluded that the REAL definition of “Self_Service BI” is , should and always will run through Microsoft Excel. And there are literally many millions of perfectly responsible Corporate spreadsheets already in place as a starting point.
With the addition of the Data Model, Power Query and DAX measures and KPIs and all the many ways to connect to external corporate data sources, Excel is perfectly placed to become the go-to middleware between your data and your Reports in Power BI. In addition there are millions and millions of people who already know how to use Excel, have faith in it and are looking for the next “story” in the distribution of their spreadsheet results. Hello Power BI !!
Like it or not Excel is where today’s “BI” work is done and will be for a looong time (or maybe forever). So why not make Excel data “work” with Power BI now ? !.
The Lay Of The Land:
I know that 10’s of millions of people in millions of companies Worldwide use Microsoft Excel to do their analysis of their businesses (not all financial as it also includes Operations, Warehousing, Production, HR, etc. etc.).
I also know that many of those spreadsheets are not the greatest designs in the World … have many serious issues some of which are actually risks to their own companies. But believe me … building a data-warehouse based BI alternative is NEVER going to be the panacea it is sold as either. In the end it will just be DATA .. then it has to all be AGGREGATED AND ANALYZED like in Excel (for example) … there are no simple answers to this issue.
First I refer to the disruption referred to earlier. That disruption is because all anyone wants to talk about are BIG all-encompassing BI solutions. Big commitments in time, money, human resources, business focus and general disruption … all for the HOPE of a successful result that preferably ends up better than all those spreadsheets they use now .. but with NO guarantee and a history of failures over many decades now.
BUT at the same time the existing models are built by people who work in their companies and understand not just the tech but also the business. I cannot explain how important that is. Frankly, to convert EVERY company away from spreadsheets to data warehousing would require an army of capable database/BI/Analysts worldwide that just cannot be grown in any future I can envision. Furthermore isn’t it ironic that despite all of this I know many, many so-called BI experts who are not exactly overwhelmed by REAL job offers at anything like an acceptable salary or rate.
I have spoken at Modeloff Global Training Camps in Toronto and New York (and hopefully in London this spring) where the attendees all fit this “spec” of serious, responsible spreadsheet “managers” (not just devs and users). There are millions of people out there in my estimate who, at least in their own minds, think they are building responsible, reliable models for their bosses. And good on them !
Excel’s Native Power BI Weaknesses:
I also know that Microsoft is out there promoting their “Native” Power BI capabilities. This is good at one level as it is actually introducing many to Power BI for the first time
But sadly, after extensive research on the capabilities of Power BI to “Pull” Excel data and Excel’s capability to “Push” data to Power BI it is my conclusion that neither of these offerings was what I would call “Industrial Strength” and are in fact going to lead users into a wall of pain … What I see indicates that these features are just built to show “some” effort has been made but these capabilities are designed to actually discourage Excel as a source of any serious business intelligence in the medium to short-term. It needs to be better…
My Conclusion:
So in the end I believe everyone should accept that spreadsheet-based analytics and most prominently EXCEL MANAGEMENT REPORTING are simply not going away any time soon – if ever. I know that this is anathema to sooooo many in the IT industry, and even, if I might be so bold, in Microsoft itself (which has always been hard for me to accept). Time for them to get over it.
But I personally see the potential of Microsoft’s Power BI (both in the tech as well as the cost and the sizeable potential market). I therefore decided that there had to be a way to help business users get value from Power BI using their existing Excel models as quickly as possible, with incremental progress rather than a “big-bang”, producing not just a short-term intermediate solution but truly reliable “Production” solutions for long-term use.

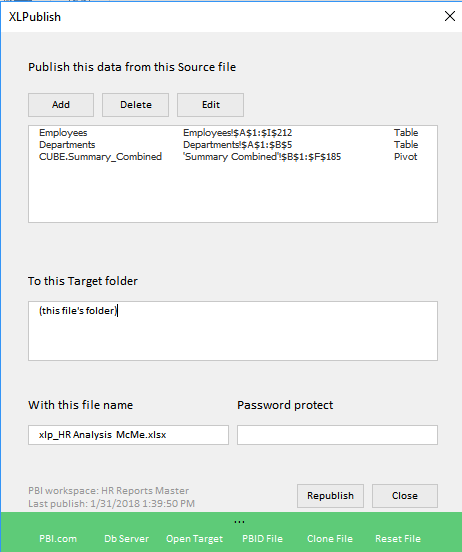
So we built the XLPublish Add-In for YOU … With it you simply select the Table, Range, Chart or Pivot Table that you wish to Publish to Power BI as the source for a Visual there and “Publish” it ! You data will be instantly refreshed in your Power BI Dashboards.
Then after making data changes in your spreadsheet (daily, weekly, monthly or whenever) you simply “Re-Publish” in XLPublish and your Power BI Dashboards will immediately reflect that change. No Data Gateways, No DBA’s, just YOUR data for YOUR Dashboard for YOUR Data Consumers !
I have Partnered with David Hoppe in the Netherlands (the king of Excel Add-Ins in my estimation) to create this product … which is now fully available for download for 30 days of free testing, followed by 5 US$ per month thereafter for only those who DEVELOP SOLUTIONS using XLPublish.
You can download it RIGHT NOW from our Website XLPublish.com where Registering in our secure licensing process will get you using XLPublish in a couple of minutes.
We have poured all of our years of experience as Excel and database developers into this product. We are certain that you’ll get value out of it IMMEDIATELY ! In fact we promise that…
While the saying is “Excel and Power BI “Better” Together” … We say “Excel and XLPublish and Power BI “Best” Together” 🙂
But the big story is “XLPublish Gives You True “Self-Service BI” Right Now !!
Please download and enjoy XLPublish. Also PLEASE reach out to us any time with any questions.
Dick
dick@xlpublish.com


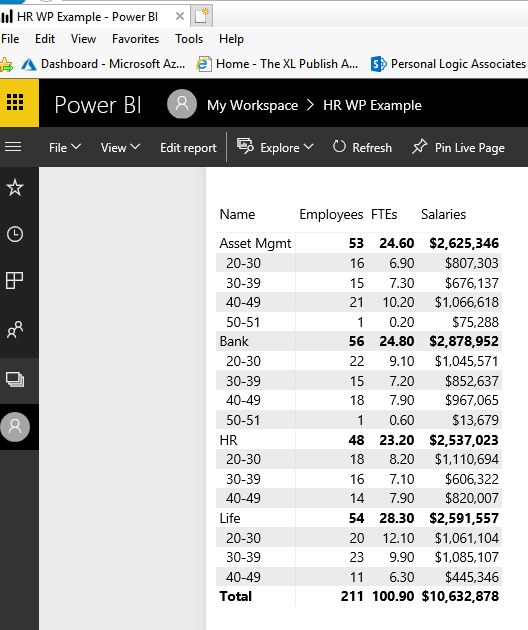
 Filtered By Departments and Age Cohorts:


